Evolutionary Quantitative Genetics Workshop
Evolutionary Quantitative Genetics Workshop
| 2022 Workshop (Online) | SCHEDULE | Resources | PREVIOUS YEARS |

| ← Previous | Next → |
Exercise 1-1: Heritability estimation by parent-offspring regression in R
Josef C Uyeda & Stevan J Arnold
In this computer exercise we will improve our intuition about heritability in a couple of ways. First, we will use actual data from a natural population to obtain a point estimate of heritability using the statistical procedure of regression. We will write and use a program that can estimate heritability for any one of the 6 traits in our dataset. Second, we will use bootstrapping to see how our point estimate of heritability is affected by the particular sample of mothers and daughters that we use.
We will use the data file, R_inland_snake_data.txt, which is a subset of the data from these two papers:
Phillips, PC and SJ Arnold. 1999. Hierarchical Comparison of Genetic Variance-Covariance Matrices. I. Using the Flury Hierarchy. Evolution, 53(5):1506-1515.
Arnold, SJ and PC Phillips. 1999. Hierarchical Comparison of Genetic Variance-Covariance Matrices. II. Coastal-Inland Divergence in the Garter Snake, Thamnophis elegans. Evolution, 53(5):1516-1527.
The first step should be to download the Google Drive folder with the exercise. Download Google Drive Folder for Exercise 1.1 During the course, I will show you how to open the file in R and access the dataset.
Your tutorial has two flavors, depending on your preferences. If you don’t have the package
dplyr installed and/or find its notation completely foreign to you, choose option 2.
Understanding the dataset in question is the first task. Here is the metadata:
The data are the values of 6 traits in a sample of mothers and their daughters from one population of a garter snake, Thamnophis elegans. The first line is the header which lists the names of the variables (8 columns):
-
local = the name of the population
-
family = the name of the family (the first row with each family name is the mother, the rows that follow with the same name are her daughters)
-
body = the number of vertebrae in the body
-
tail = the number of vertebrae in the tail
-
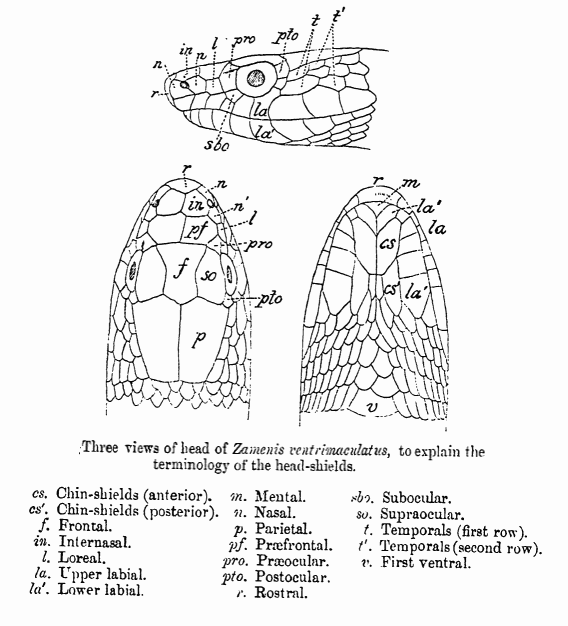
mid = the number of scale rows around the snake, assessed at the middle point of the body
-
ilab = the number of scales on the lower lip (infralabials, sum of left and right sides)
-
slab = the number of scales on the upper lip (supralabials, sum of left and right sides)
-
post = the number of scales behind the eye (postoculars, sum of left and right sides) Missing values are denoted by NA. More information on the traits and the sample can be found in Phillips & Arnold (1999) and Arnold & Phillips (1999).